Augmented Software Visualization
Meeting
 Shonan Village Center
 November 27 - 30, 2023 (Check-in: November 26, 2023)
Organizers
 Leonel Merino
Pontificia Universidad Catolica de Chile
Chile
 Craig Anslow
Victoria University of Wellington
New Zealand
 Takashi Ishio
Future University Hakodate
Japan
 Alexandre Bergel
RelationalAI
USA
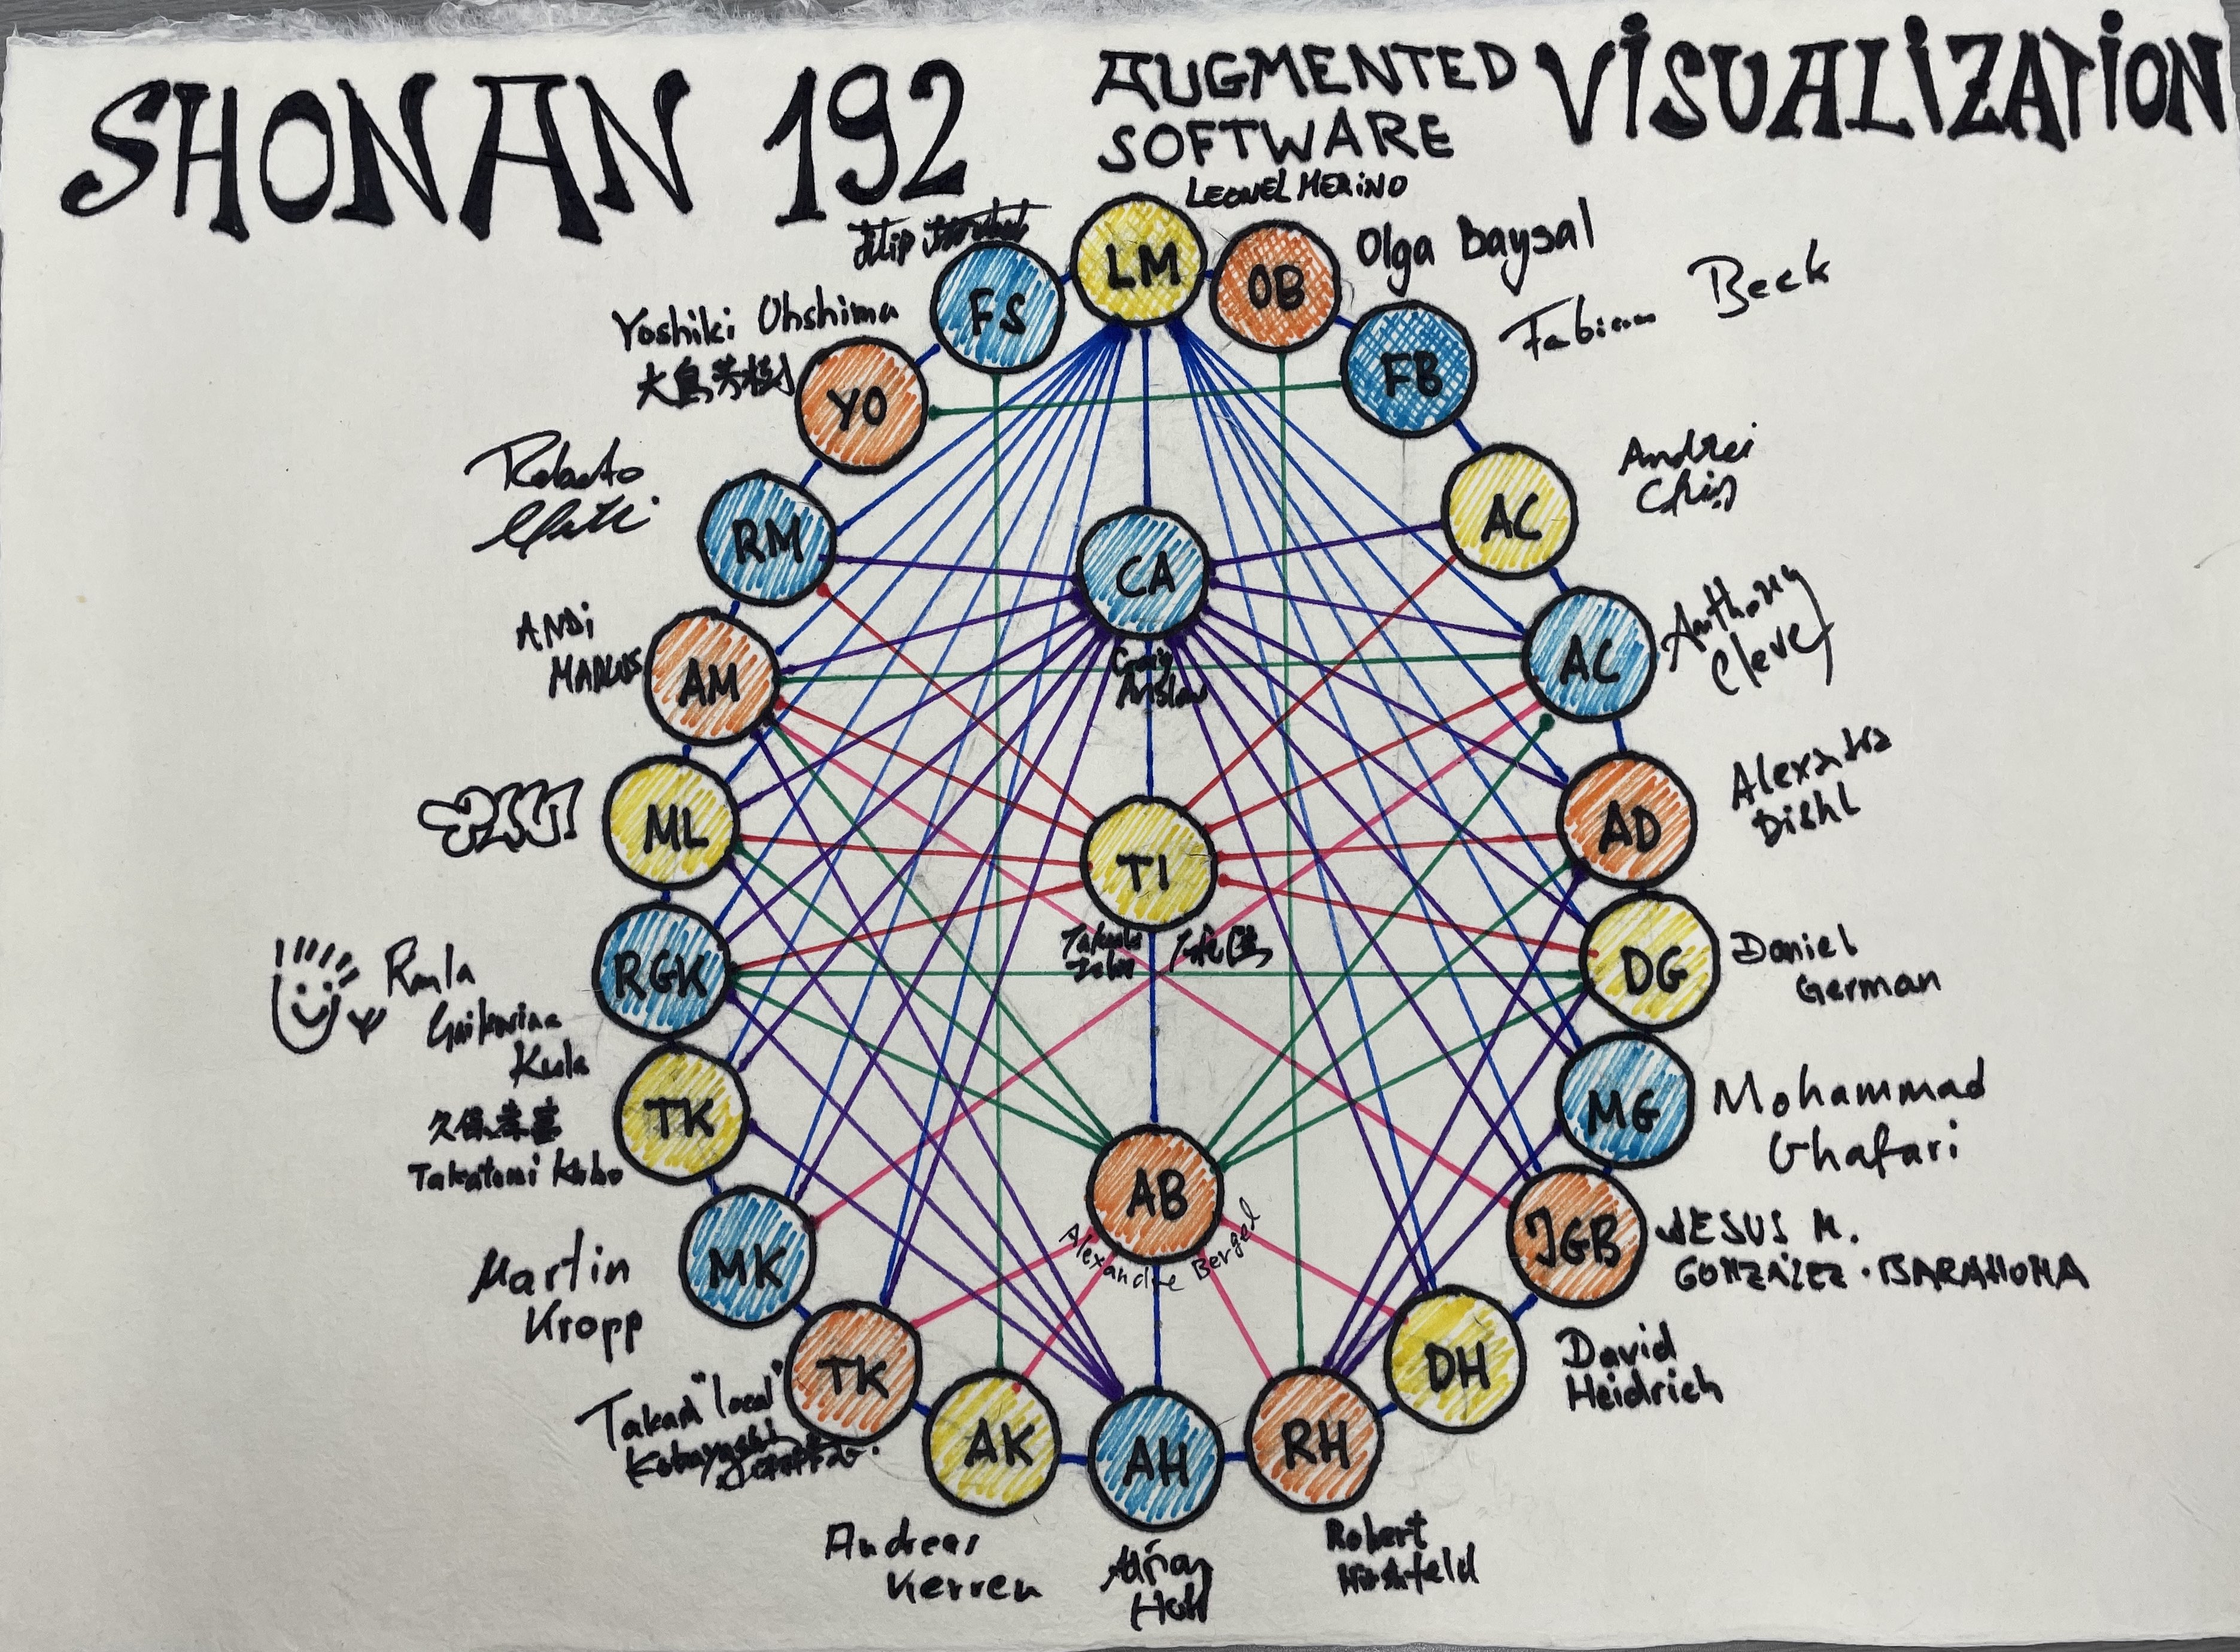
Participants
Olga Baysal, Carleton University
Fabian Beck, University of Bamberg
Andrei Chis, Feenk (Bern)
Anthony Cleve, University of Namur
Alexandra Diehl, University of Zurich
Stephan Diehl, University of Trier
Daniel German, University of Victoria
Mohammad Ghafari, Technical University of Clausthal
Jesús González-Barahona, Universidad Rey Juan Carlos
David Heidrich, DLR
Robert Hirschfeld, Hasso Plattner Institute, University of Potsdam
Adrian Hoff, IT University of Copenhagen
Andreas Kerren, Linköping University
Takashi Kobayashi, Tokyo Institute of Technology
Martin Kropp, University of Applied Sciences and Arts Northwestern Switzerland
Takatomi Kubo, Nara Institute of Science and Technology
Raula Gaikovina Kula, Nara Institute of Science and Technology
Michele Lanza, Software Institute – USI, Lugano
Andrian Marcus, George Mason University
Roberto Minelli, Software Institute – USI, Lugano
Yoshiki Ohshima, Croquet Corporation
Filip Strömbäck, Linköping University
Overview
Visualization is “the use of computer-supported, interactive, visual representations of abstract data in order to amplify cognition.” Software visualization is the use of such interactive and visual representations of software data for supporting software development activities. In the last two decades, multiple studies have been published across main software engineering journals (e.g., TSE, IST, JSS, JSEP) and conferences (e.g., ICSE, FSE, ICSME, ASE, MSR), confirming software visualization as a relevant topic in software engineering research. Nowadays, the field of software visualization is at the junction of two singular situations: (1) modern software systems are developed involving multiple sophisticated techniques and exhibit an increasing complexity, and (2) a variety of sensory technologies, such as virtual and augmented reality, eye-tracking, physiological sensors, are increasingly more available to both researchers and practitioners. These sensory technologies do not only represent opportunities to investigate visualizations suitable for complex systems but also to evaluate the impact of such visualizations on human cognition. We consider this Shonan meeting to be a unique and extraordinary tool to reflect on the challenges.
The goal of the Shonan meeting is to reflect on the following challenges of software visualization: sensory augmentation, cognitive methods, and software complexity.
Sensory Augmentation. Traditionally, developers have interacted with software visualizations through windows, icons, menus, and pointers (WIMP) as they do when developing software systems. However, recent years have seen a number of advanced devices that significantly augment the way that humans can sense the real world. For instance, augmented and virtual reality (AR/VR) technology is becoming mature and affordable. Also, eye-tracking and other physiological technologies are often present in smartphones and laptops. Indeed, a few SVs have explored the use of a medium to display visualizations different than the computer screen and the use of interaction techniques different than windows, icons, menus, and pointers. We ask: What is the role of sensory augmentation in comprehending software systems?
Cognitive Methods. User evaluations in software engineering have focused on user performance, which has been almost always carried out by measuring the accuracy and the time users require to complete a task. Consequently, software visualization evaluations have been limited to analyzing user performance. Accuracy and completion time can be useful for analyzing cognitive aspects such as decision-making and problem-solving. However, multiple other cognitive aspects have been grossly neglected from evaluations, such as cognitive load, learnability, emotions, memory, and attention. Cognitive aspects often interplay, and therefore, measures of high accuracy and little completion time can result from multiple cognitive aspects that should be included in user evaluations. We ask: How do we adopt cognitive methods in software visualization evaluations?
Software Complexity. Software systems have reached a complexity that humanity has never experienced before. The evolution of hardware and software exposition to a large audience has contributed to the increasing complexity of software systems. Nowadays, software systems are written in numerous programming languages and run on many executing platforms. As such, making software visualizations able to cope with the complexity is challenging. We ask: How can visualizations deal with the increasing complexity of software systems?
The results of the discussions will be collected as recommendations for using sensory augmentation to support software development activities. In particular, we would like to elaborate on the strengths and weaknesses of technologies, application domains, and implications for user evaluations. Finally, we would like to define guidelines for using cognitive methods in user evaluations. Concretely, we could (1) identify cognitive aspects that can play a role in user evaluations, (2) describe available data collection methods suitable for the analysis of those aspects, and (3) elaborate on how can researcher use those methods in practice.
We also would like to describe research opportunities in using visualization to deal with software complexity. Specifically, we plan to outline project ideas of various sizes (e.g., paper project ideas, bachelor and master project ideas, and ideas for larger projects) that could be eventually funded and then realized by the community in the future.
Keynotes
“Showcases of Human-centered Visualization Research Relevant for Augmented SoftVis”, Andreas Kerren
 Abstract: My talk will overview our research in information visualization, human-computer interaction, and immersive analytics which may be relevant for reaching the goals of this Shonan meeting. I will exemplify solutions that my research groups at Linnaeus and Linköping Universities have developed over the past years. They cover areas such as explainable AI, Vis4ML, technologies for emotion-enhanced interaction, and collaborative immersive analytics systems. All together I hope that this talk can serve as a starting point for further discussions and the identification of a research agenda in augmented software visualization.
“Babylonian-style Programming: Example-based, Live, Exploratory”, Robert Hirschfeld
Time Table
Sunday, November 26
19:00 Welcome Banquet
Monday, November 27
09:00 Welcome
09:15 Keynote: “Showcases of Human-centered Visualization Research Relevant for Augmented SoftVis”, Andreas Kerren
10:00 Break
10:30 Lightning Talks
12:00 Lunch
13:30 Group Photo Shooting
14:00 Breakout Session 1
15:30 Break
16:00 Breakout Session 2
17:15 Groups Presentations
18:00 Dinner
Tuesday, November 28
09:00 Program briefing
09:15 Keynote: “Example-based Live, Exploratory Programming”, Robert Hirschfeld
10:00 Break
10:30 Breakout Session 3
12:00 Lunch
13:30 Breakout Session 4
15:30 Break
16:00 Group Presentations
16:30 Informal Demo Session
18:00 Dinner
Wednesday, November 29
09:00 Program briefing
09:15 Breakout Session 5
10:00 Break
10:30 Breakout Session 6
12:00 Lunch
13:30 Excursion: Jomyoji and Hokokuji Temple
18:15 Main Banquet
Thursday, November 30
09:00 Program briefing
09:15 Breakout Session 7
10:00 Break
10:00 Conclusion/ Wrap-up
12:00 Lunch